
Global Broker Regulation Inquiry App
WikiFX
English
简体中文
繁體中文
English
Pусский
日本語
ภาษาไทย
Tiếng Việt
Bahasa Indonesia
Español
हिन्दी
Filippiiniläinen
Français
Deutsch
Português
Türkçe
한국어
العربية
Volatility Surges as the Economic Cycle Enters a Prosperity Phase
Abstract:According to the latest FactSet earnings report (as of November 7), the SP 500 is currently trading at a price-to-earnings ratio of 22.7x. Elevated valuations remain the main reason for our cautious s
According to the latest FactSet earnings report (as of November 7), the S&P 500 is currently trading at a price-to-earnings ratio of 22.7x. Elevated valuations remain the main reason for our cautious stance on the overall market. However, as the title suggests, the economic cycle has now firmly entered the expansionary phase—a period when fundamentals may decouple from market prices for a while. That divergence could last for quite some time—or end abruptly.
As economic data analysts, we caution against over-interpreting short-term market signals. Doing so may lead investors to exit positions too early or even short the market prematurely. Conversely, over-reading macro data without maintaining long exposure may cause investors to miss potential gains. During a boom cycle, the right mindset is never to go all-in—allocating no more than 50% of capital helps investors stay mentally steady amid sharp rallies and corrections, while retaining agility to respond to new market developments.
FactSet‘s November 7 data show that 2025 revenue is projected to grow 8.3%, while earnings are expected to rise 13.1%—a sign that corporate profitability is outpacing sales growth, indicating that corporate momentum is now on an upward slope. This impressive earnings strength continues to justify today’s high valuation multiples.
")
(Chart 1: S&P 500 Revenue and Earnings Performance | Source: FactSet)
When investors collectively envision a brighter future, they become more willing to embrace risk assets. In our view, this optimistic sentiment has already defined a ceiling for gold prices. According to the CNN Fear & Greed Index, the current reading is 21, suggesting a market mood that is cautious rather than euphoric. We interpret this not as a FOMO (Fear of Missing Out) environment, but rather as a bubble without imminent downside reversal risk.
")
(Chart 2: CNN Fear & Greed Index | Source: CNN)The Dollar and Gold: A Return to Negative Correlation
Over the past three years, the relationship between the U.S. dollar index and gold prices has undergone a rare “decoupling.” Recently, however, both assets appear to be reverting to their traditional inverse correlation—when the dollar strengthens, gold weakens, and vice versa.
From 2021 to 2022, both the dollar and gold rallied simultaneously as U.S. inflation surged to a 40-year high. Investors bought dollars to hedge against rate-hike risks and gold to guard against currency debasement—creating a rare dual rally driven by liquidity and risk aversion rather than fundamentals.
In 2023, during the final leg of the Feds tightening cycle, the dollar strengthened further while gold remained resilient. Treasury yields rose steadily, yet recession concerns kept gold prices supported—a reflection of investors seeking dual hedges amid uncertainty.
By the second half of 2025, the dollar index (blue line) has begun to stabilize and rebound, while gold (yellow line) has retreated sharply from its highs. Three major shifts explain this transition:
Inflation has cooled and real yields have risen.
As core PCE declines, golds inflation-hedging appeal weakens, while higher real yields make the dollar more attractive.
Monetary policy cycles are converging globally.
With the ECB, BoC, and BoJ all ending their easing programs, the global policy gap has narrowed, transforming the dollar back into a yield asset rather than a safe haven.
Geopolitical risk premiums have faded.
Waning hedging demand from the Russia-Ukraine war and Middle East conflicts has stripped gold of part of its risk-premium momentum.
(Chart 3: U.S. Dollar Index vs. Gold Prices | Source: M-Square)
Technical Outlook for Gold
")
This renewed negative correlation signals that capital flows are returning to a normalized cycle.
A strong dollar indicates renewed confidence in U.S. assets, while golds pullback marks the end of the inflation trade and tighter liquidity conditions. For investors, this means safe-haven assets will no longer rise in tandem, demanding a reassessment of portfolio allocation strategies.
If the Fed keeps rates elevated for longer, the dollar may stay strong and gold could remain under pressure. Conversely, if the U.S. economy weakens and yields fall, gold could rebound—but only if the dollar begins a structural downtrend.
From our current analysis, that structural dollar weakness has already ended, and a long-term uptrend appears firmly in place.
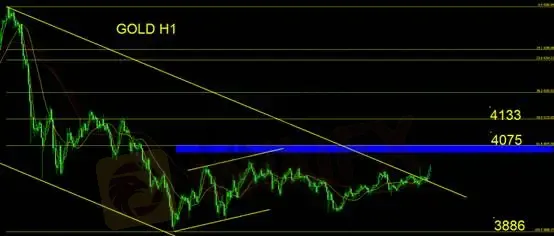
Gold has traded sideways for ten consecutive sessions, within a range of $3,886–$4,075. Using Fibonacci retracement analysis, prices are hovering between the 38.2% and 100% levels of the prior downtrend. Volatility remains elevated—watch for resistance at $4,075 and $4,133.
If price action stalls and forms a bearish reversal candle , short positions can be considered, with a stop-loss of 50 points.
At this stage, theres no clear signal of a bullish reversal, and investors should avoid aggressive long positions until stronger confirmation emerges.
Disclaimer:
The views in this article only represent the author's personal views, and do not constitute investment advice on this platform. This platform does not guarantee the accuracy, completeness and timeliness of the information in the article, and will not be liable for any loss caused by the use of or reliance on the information in the article.
WikiFX Broker
Latest News
2 Malaysians Arrested in $1 Million Gold Scam Impersonating Singapore Officials
 WikiFX
Moomoo Singapore Opens Investor Boutiques to Strengthen Community
WikiFXOmegaPro Review: Traders Flood Comment Sections with Withdrawal Denials & Scam Complaints
WikiFXAn Unbiased Review of INZO Broker for Indian Traders: What You Must Know
WikiFXBotBro’s “30% Return” Scheme Raises New Red Flags Amid Ongoing Fraud Allegations
WikiFXThe 5%ers Review: Is it a Scam or Legit? Find Out from These Trader Comments
WikiFXWikiEXPO Dubai 2025 Concludes Successfully — Shaping a Transparent, Innovative Future
WikiFXAdmirals Cancels UAE License as Part of Global Restructuring
WikiFXForex Expert Recruitment Event – Sharing Insights, Building Rewards
WikiFXExness Broker Expands in South Africa with Cape Town Hub
WikiFXCurrency Calculator
USD

CNY
Current Rate: 0
Amount
USD
Available
CNY
Calculate