
Global Broker Regulation Inquiry App
WikiFX
English
简体中文
繁體中文
English
Pусский
日本語
ภาษาไทย
Tiếng Việt
Bahasa Indonesia
Español
हिन्दी
Filippiiniläinen
Français
Deutsch
Português
Türkçe
한국어
العربية
Gold Continues With Strong Upward Momentum and the Potential to Move Higher
Abstract:Gold continues to gain ground with very strong technical potential to move substantially higher.

Over the last five trading days, gold hit a bottom at approximately $1621 and gained well over $100 in a short time. As of 5:21 PM, EDT gold futures basis the most active December contract is currently trading at $1734.70 after factoring in todays gain of $32.70 or 1.92%.
In the same way that gold bottomed five trading days ago on Wednesday, September 28, concurrently the dollar peaked on the same day hitting its highest value in 20 years. Today the dollar continues to fall dropping by 1.42% with the dollar index currently fixed at 110.065.
Over our last two reports, we have been focusing on the key reversal last Wednesday. By Friday of last week, that assumption was confirmed and the dollar had experienced a key reversal from bullish to bearish, just as gold experience a bottom at precisely the same time as market sentiment shifted from bearish to bullish.
To come up with this conclusion we use two types of Japanese charts that differ from the standard candlestick chart that many are familiar with. The studies we used are based on both a three-line break chart and the Heinkin-Ashi chart.
Both chart types were developed by Japanese traders and are primarily used to determine the strength of the trend as well as pivot points or key reversals. In yesterdays letter, we looked at both the dollar and gold through the eyes of these charts and conveyed why we derived that gold had entered a rally just as the dollar began a correction.
Have We Properly Identified Key Reversals in Gold and U.S. Dollar?
In todays letter, we want to answer a much more important question. The question is if we properly identified key reversals in both gold and the dollar where can we expect to find resistance in gold, and support in the dollar? To that end, we are utilizing two basic techniques which are Fibonacci retracements and the identification of past tops and bottoms to indicate potential support or resistance areas.

The chart above is a daily candlestick chart of gold futures. We have labeled potential areas of resistance based on a Fibonacci retracement and the identification of key tops in the market that could also be markers that could indicate resistance.
The Fibonacci retracement data set begins at this years high of $2078 and ends at the low of $1621 that occurred five trading days ago. Currently gold is trading at $1734.70 and our technical studies indicate that the first potential level of resistance has just been passed at $1730.20 which is based on the 23.6% Fibonacci retracement.
Above that price point, the first potential point of resistance should gold continues to move higher occurs at $1796.70. That is based upon the 38.2% Fibonacci retracement from the same data set. Lastly, there is potential resistance at $1825.10 which is the top that occurred in mid-August.

The chart above is a daily candlestick chart of the dollar index and a Fibonacci retracement data set. The data set begins in January of this year when the dollar index was trading at 94.683 and concludes at the recent high that occurred last Wednesday when the dollar index hit its highest value in the last 20 years at 114.704.
Bottom Line
Based on our studies the dollar index is currently at the first potential price point where support could be found at 109.979 which is the 23.6% Fibonacci retracement. Currently, the dollar index is at 110.065 just above that price point. Below that is the 38.2% Fibonacci retracement that occurs at 107.056. Finally, there is the potential to find support at the 50% retracement which is at 104.693.

Disclaimer:
The views in this article only represent the author's personal views, and do not constitute investment advice on this platform. This platform does not guarantee the accuracy, completeness and timeliness of the information in the article, and will not be liable for any loss caused by the use of or reliance on the information in the article.
Long
Short
Slippage
Leverage
Indicator
Quoted currency
Roll-Over
US Non-farm Payrolls
Broker
Clearing
Commission
Currency Pair
Dealer
Future
Inflation
Arbitrage
Spot Market
Spot Price
Contract
Interest
Net Position
Devaluation
BOE
PBOC
Volume
Liquidity
Margin
knowledge
Learn basic forex
Forex trading
Forex margin
Forex Chart
Forex indicator
support and resistance
Forex Broker
Forex strategy
Forex Currency pair
Forex Analysis
Forex news
leverage in forex
forex pips
Basic forex knowledge
forex market
forex beginners
FSCA
monetary policy
mortgage-backed securities
interest rates
inflationary
Non-farm payrolls
Ramadan
Stock
Read more

Trive Investigation: High Score, Hidden Risk - The Profit Paradox
A disturbing pattern has emerged regarding the broker Trive. Despite holding a high WikiFX score (7.91) and valid licenses in South Africa and Australia, recent investor reports suggest a significant disconnect between the platform's reputation and its treatment of profitable clients. While the regulatory paperwork appears in order, our data indicates that traders are facing sudden account freezes and accusations of "trading abuse" precisely when they attempt to withdraw profits. This report investigates why a seemingly "safe" broker is generating high-risk complaints.
Original 22m

Merin Regulation Review 2025: Is Merin a Safe and Legitimate Broker?
The online trading industry is filled with both regulated brokers and high-risk offshore platforms. Among them, Merin is a forex broker that recently attracted public attention. As more traders look into Merin, a key question arises: What is the Merin regulation status, and is Merin safe or a potential scam?
Original 44m
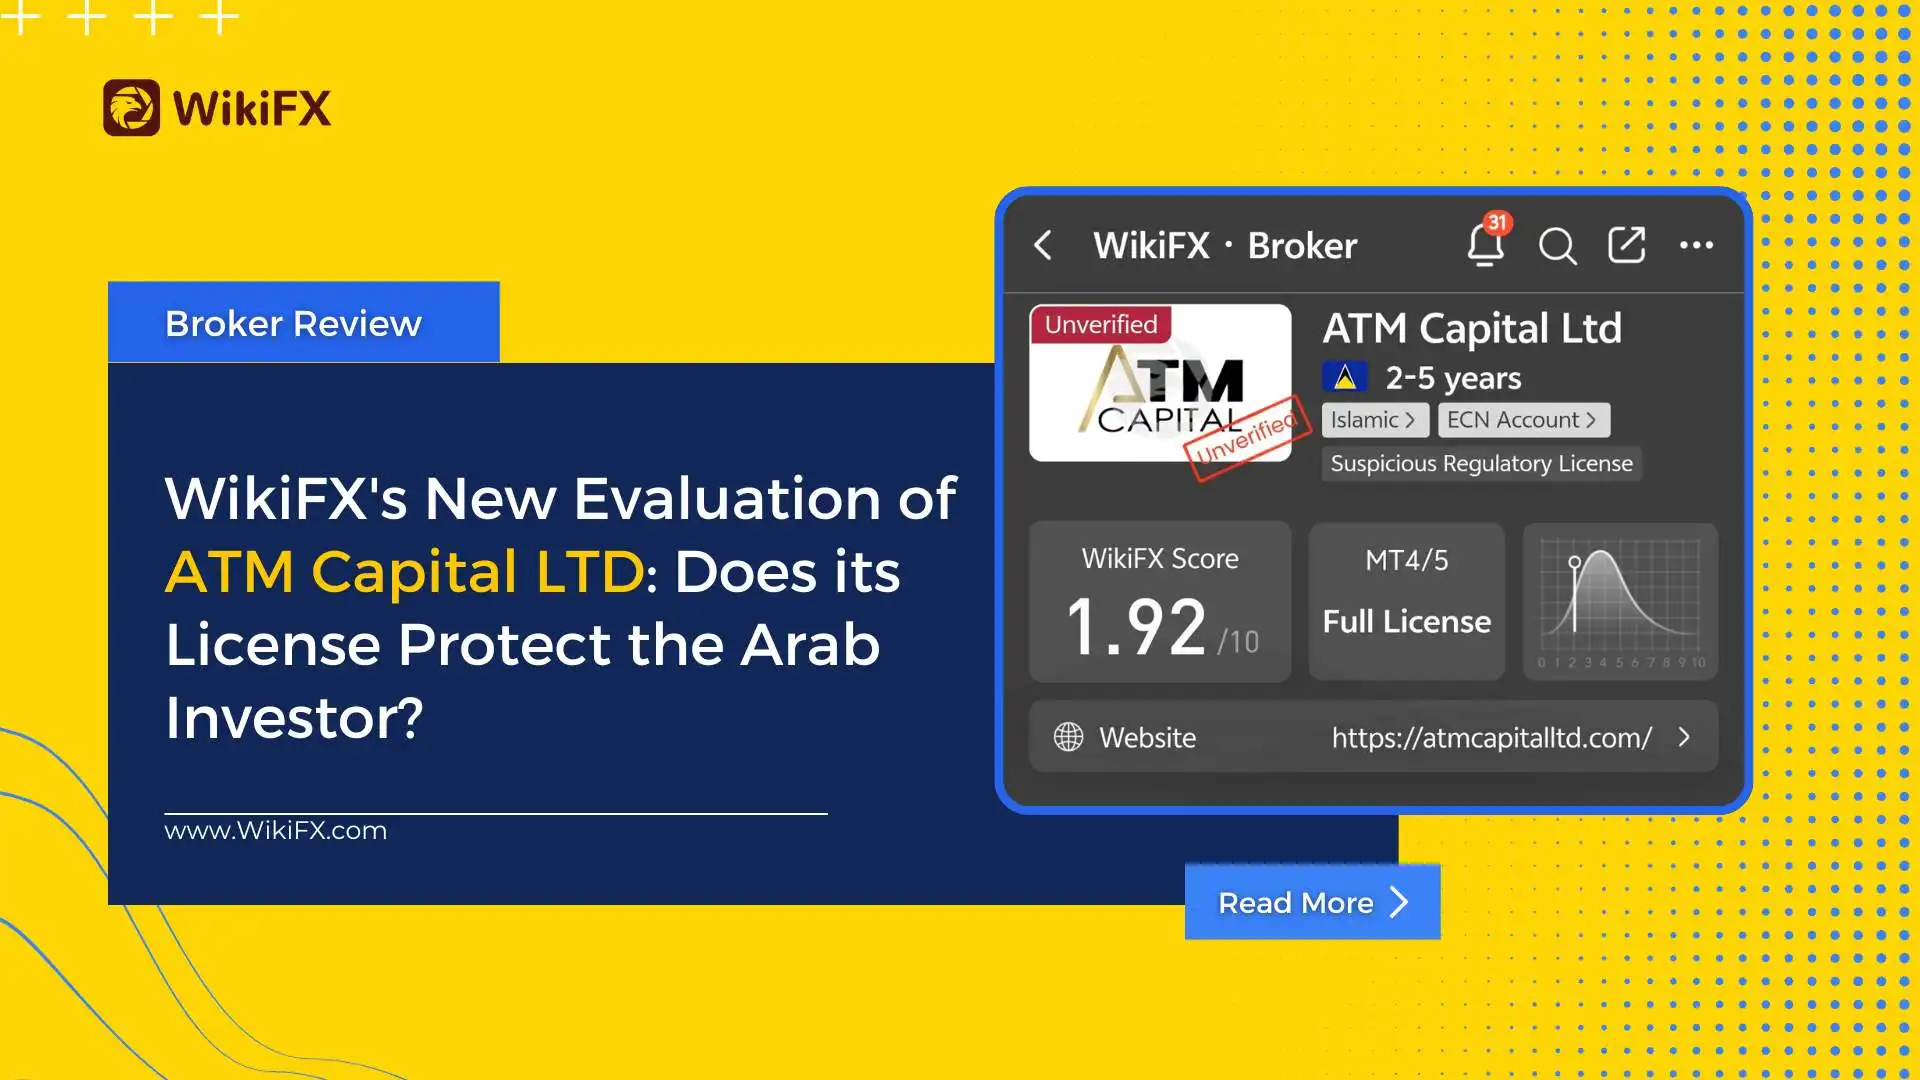
WikiFX's New Evaluation of ATM Capital LTD: Does its License Protect the Arab Investor?
WikiFX Evaluation reveals that ATM Capital LTD only scored 1.92 points. Check the company's unverified license and the risks of Arab investment.
Original 6h
Seaprimecapitals Withdrawal Problems: A Complete Guide to Risks and User Experiences
Worries about Seaprimecapitals withdrawal problems and possible Seaprimecapitals withdrawal delay are important for any trader. Being able to get your money quickly and reliably is the foundation of trust between a trader and their broker. When questions come up about this basic process, it's important to look into what's causing them. This guide will tackle these concerns head-on, giving you a clear, fact-based look at Seaprimecapitals' withdrawal processes, user experiences, and trading conditions. Most importantly, we'll connect these real-world issues to the single most important factor behind them: whether the broker is properly regulated. Understanding this connection is key to figuring out the real risk to your capital and making a smart decision.
Original Three days ago
WikiFX Broker
Latest News
WikiFX's New Evaluation of ATM Capital LTD: Does its License Protect the Arab Investor?
 WikiFX
Is Axi Legit? A Data-Driven Analysis of Its Regulatory Standing and Trader Feedback
WikiFXHow a Fake Moomoo Ad Led to the “New Dream Voyage 5” Scam
WikiFXTrive Investigation: High Score, Hidden Risk - The Profit Paradox
WikiFXBessent believes there won't be a recession in 2026 but says some sectors are challenged
WikiFXIs GGCC Legit? A Data-Driven Analysis for Experienced Traders
WikiFXB2BROKER Gains Investment Bank Status in Labuan
WikiFXIn-Depth Review of INZO Trading Conditions and Product Offering – A Data-Driven Analysis
WikiFXMerin Regulation Review 2025: Is Merin a Safe and Legitimate Broker?
WikiFXCurrency Calculator
USD

CNY
Current Rate: 0
Amount
USD
Available
CNY
Calculate