简体中文
繁體中文
English
Pусский
日本語
ภาษาไทย
Tiếng Việt
Bahasa Indonesia
Español
हिन्दी
Filippiiniläinen
Français
Deutsch
Português
Türkçe
한국어
العربية
Trading Pattern of the Evening Star
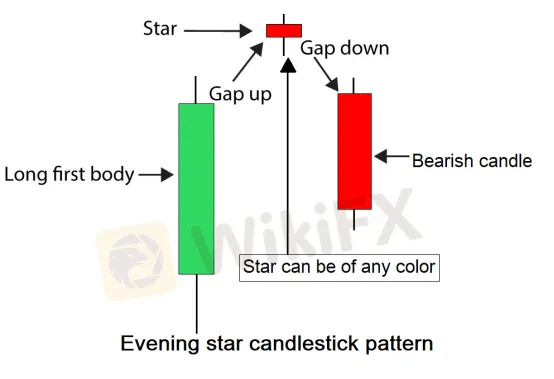
Abstract:The bearish evening star is a three-candlestick pattern with a lengthy and bullish first candle, a gap upward on the second candlestick, and a very narrow range on the third candlestick. This is thought to signify a star in the sky announcing the arrival of darkness, and so bearish. A lower gap and a longer candlestick make up the third candlestick.
What is the Candlestick Pattern of the Evening Star?
The bearish evening star is a three-candlestick pattern with a lengthy and bullish first candle, a gap upward on the second candlestick, and a very narrow range on the third candlestick. This is thought to signify a star in the sky announcing the arrival of darkness, and so bearish. A lower gap and a longer candlestick make up the third candlestick.
How does the evening star candlestick pattern work? When this pattern forms, you'll see a gap higher, followed by a gap lower, and a lot of selling pressure. This indicates that the buyers have been blown out, putting downward pressure on the market. This frequently indicates that a large selloff is imminent. While most people think of this as a candlestick pattern that appears at a swing high, it may appear anywhere on a chart.
Examine the chart of Nike stock below for an example of the evening star candlestick formation. The market had been in an uptrend, gaped higher to create a short candlestick, and then gapped down on the third day to indicate symptoms of fatigue, as shown in the highlighted region. Most traders will sell this set up short if it breaks below the bottom of the lowest of the three candlesticks, with a stop loss placed at the top of the star (the middle candlestick). While some purists insist that the “star” must be a doji, the star just has to be smaller than the other two candlesticks to indicate a slowdown of speed.
The most common approach to trade this pattern is to purchase on a break of the higher of the two long candlesticks, with a stop loss below the star's bottom. I've included another example below, this time using Nike stock, because it demonstrates several reasons to believe the pattern would work. You have the pattern itself, as well as the first candlestick, which turned out to be a “inverted hammer,” and breaking over the top of that wick was a good indicator to go long. As you can see, the market blasted off from that moment, gaping higher, pulling back to close the gap, and then turning around to head for $59 again.
These patterns might be highly beneficial depending on the market you're trading. After all, you have to remember that something has to cause the market gap to rise, then fall, or vice versa. To put it another way, as soon as one side of the market gained ground, the other side fought back and took it away. That is a really strong signal since it demonstrates a rapid shift in attitude over the period of a few days. While this is a relatively uncommon pattern in the currency markets, it does tend to perform well in the stock commodities markets, which are often less liquid than Forex.
Disclaimer:
The views in this article only represent the author's personal views, and do not constitute investment advice on this platform. This platform does not guarantee the accuracy, completeness and timeliness of the information in the article, and will not be liable for any loss caused by the use of or reliance on the information in the article.
Read more
Scandinavian Capital Markets Exposed: Traders Cry Foul Play Over Trade Manipulation & Fund Scams
Does Scandinavian Capital Markets stipulate heavy margin requirements to keep you out of positions? Have you been deceived by their price manipulation tactic? Have you lost all your investments as the broker did not have risk management in place? Were you persuaded to bet on too risky and scam-ridden instruments by the broker officials? These are some burning issues traders face here. In this Scandinavian Capital Markets review guide, we have discussed these issues. Read on to explore them.
Uniglobe Markets Deposits and Withdrawals Explained: A Data-Driven Analysis for Traders
For any experienced trader, the integrity of a broker isn't just measured in pips and spreads; it's fundamentally defined by the reliability and transparency of its financial operations. The ability to deposit and, more importantly, withdraw capital seamlessly is the bedrock of trust between a trader and their brokerage. When this process is fraught with delays, ambiguity, or outright failure, it undermines the entire trading relationship. This in-depth analysis focuses on Uniglobe Markets, a broker that has been operational for 5-10 years and presents itself as a world-class trading partner. We will move beyond the marketing claims to scrutinize the realities of its funding mechanisms. By examining available data on Uniglobe Markets deposits and withdrawals, we aim to provide a clear, evidence-based picture for traders evaluating this broker for long-term engagement. Our investigation will be anchored primarily in verified records and user exposure reports to explain the Uniglobe Mar
In-Depth Review of Uniglobe Markets Trading Conditions and Account Types – An Analysis for Traders
For experienced traders, selecting a broker is a meticulous process that extends far beyond headline spreads and bonus offers. It involves a deep dive into the fundamental structure of a broker's offering: its regulatory standing, the integrity of its trading conditions, and the flexibility of its account types. Uniglobe Markets, a broker with an operational history spanning over five years, presents a complex case study. It offers seemingly attractive conditions, including high leverage and a diverse account structure, yet operates within a regulatory framework that demands intense scrutiny. This in-depth analysis will dissect the Uniglobe Markets trading conditions and account types, using data primarily sourced from the global broker inquiry platform, WikiFX. We will explore the Uniglobe Markets minimum deposit, leverage, and account types to provide a clear, data-driven perspective for traders evaluating this broker as a potential long-term partner.

In-Depth Review of MH Markets Trading Conditions and Leverage – An Analysis for Experienced Traders
For experienced traders, selecting a broker is a meticulous process that extends far beyond marketing claims and bonus offers. It involves a granular analysis of the core trading environment: the quality of execution, the flexibility of leverage, the integrity of the regulatory framework, and the suitability of the conditions for one's specific strategy. MH Markets, a broker with a 5-10 year operational history, presents a complex and multifaceted profile that warrants such a detailed examination. This in-depth review dissects the MH Markets trading conditions and leverage, using primary data from the global broker inquiry app, WikiFX, to provide a clear, data-driven perspective. We will analyze the broker's execution environment, account structures, and regulatory standing to determine which types of traders might find its offering compelling and what critical risks they must consider.
WikiFX Broker
Latest News
The 350 Per Cent Promise That Cost Her RM604,000
"Just 9 More Lots": Inside the Endless Withdrawal Loop at Grand Capital
GCash Rolls Out Virtual US Account to Cut Forex Fees for Filipinos
Garanti BBVA Securities Exposed: Traders Report Unfair Charges & Poor Customer Service
Private payroll losses accelerated in the past four weeks, ADP reports
INZO Commission Fees and Spreads Breakdown: A 2025 Data-Driven Analysis for Traders
Gratitude Beyond Borders: WikiFX Thank You This Thanksgiving
Core wholesale prices rose less than expected in September; retail sales gain
Consumer confidence hits lowest point since April as job worries grow
MH Markets Commission Fees and Spreads Analysis: A Data-Driven Breakdown for Traders
Currency Calculator


